Why Bitcoin (BTC) Price May Be Set to Breakout in July

Bitcoin (BTC) has made a strong start to the new month after the price fell short of expectations for a large part of 2024’s second quarter (Q2). Trading at $63,255, the price increased by 3.11% in the last 24 hours.
Investors will be interested in whether the coin will continue its run or fare better. This analysis affirms the possibility of a higher price by the end of July unless something unexpected happens.
Bitcoin Miners Reduce High Selling Activity
Miners were one of the factors that grounded Bitcoin’s price to a halt in the last few months. In April, Bitcoin miners, who are responsible for verifying transactions on the network, saw their rewards halve.
Afterward, revenue dropped as they found it challenging to keep up with operating costs. Consequently, they sold some of their BTC. According to CryptoQuant, Miner-to-Exchange Transactions jumped up until June 8.

The Miner-to-Exchange Transactions metric measures the number of Bitcoin coins sent into exchanges from miners’ reserves. When it increases, BTC drops. However, a notable decline provides stability for Bitcoin’s price — either it increases or the value trades sideways.
Read More: 5 Platforms to Buy Bitcoin Mining Stocks After 2024 Halving
Speculation spread that the metric would jump again, but that did not happen, as it seems miners are done with distribution. As seen above, only 129 BTC affiliated with miners were sent to exchanges.
This is an extremely low figure compared to June 8, when the number was 1,279 BTC. Should the value continue to drop, Bitcoin might keep its head above $60,000 through July. In a highly bullish scenario, the price can retest $65,000 to $67,000.
Historical Trends Raise Eyebrows
Another metric supporting a price increase is Bitcoin’s Delta Gradient. The Delta Gradient model assesses the rate of price change compared to the capital inflows into Bitcoin.
It also considers the gradient of the spot BTC value and the realized price. The difference between these values is what gives the Delta Gradient.
If the metric is positive, it means that investors should expect an uptrend within a specified period. On the other hand, a negative gradient implies that returns may be negative.
At press time, using Glassnode’s data, the 28-day Bitcoin Delta Gradient is -1.62. Typically, this is supposed to drive a downtrend for BTC. However, that may not be the case, as it is an improvement from a few days ago when the reading was -2.90.
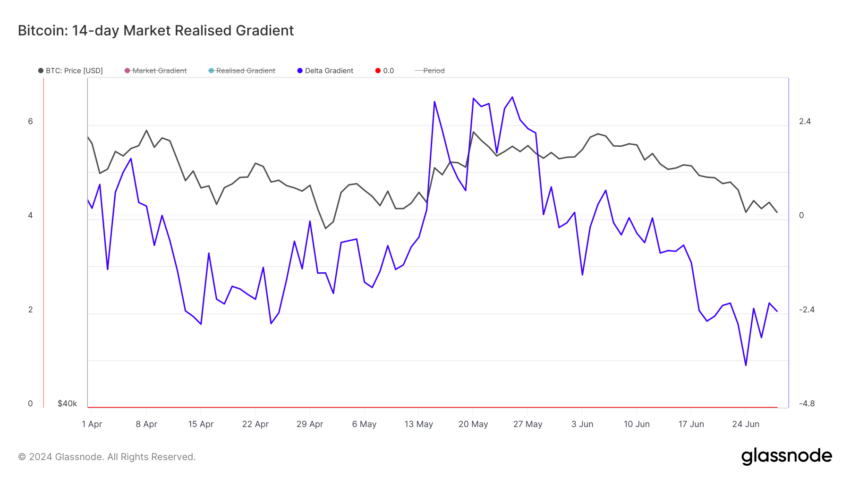
Should the reading of the metric above continue to rise, so will BTC. Furthermore, a jump into the positive region could confirm Bitcoin’s price hike.
Meanwhile, analysts on social media shared their views about this month’s performance. For example, Ali Martinez wrote on X that BTC may bounce strongly in July.
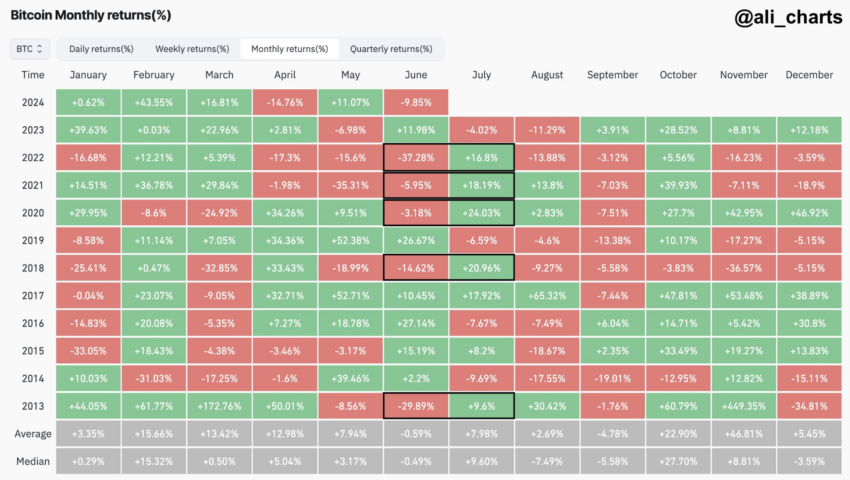
Referring to the coin’s previous returns in the seventh month, he explained that:
“Historically, when Bitcoin has had a negative June, it tends to bounce back strongly in July. In fact, BTC has shown an average return of 7.98% and a median return of 9.60% during this month.”
BTC Price Prediction: $67,000 or Nothing?
According to the daily BTC/USD chart, the coin had formed a Cup and Handle pattern. This pattern appears when the price forms a rounded bottom (cup) and later tests new lows to form the handle.
The cup and handle pattern acts as a bullish signal, indicating that an upward breakout could have the strength to keep moving north. Looking at the Fibonacci retracement to spot support and resistance levels, BTC could hit $64,966 if the upswing continues.
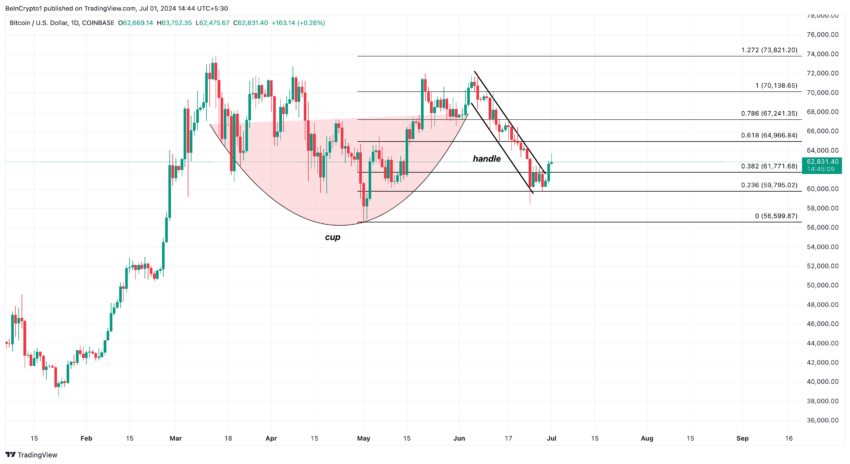
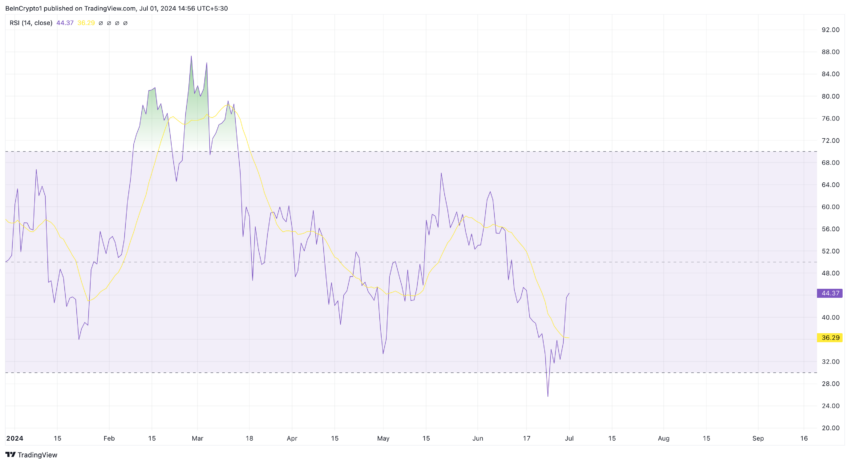
From a more bullish perspective, the coin’s price may reach $67,241 before the month ends. In addition, the Relative Strength Index (RSI) is starting to move up. The rise in the RSI means that Bitcoin is leaving the bearish reigns.
However, to validate the price prediction, the RSI reading needs to cross over the 50.00 neutral zone. If this happens, BTC will continue its upswing and potentially surpass $64,000 in a few days.
Read More: Bitcoin (BTC) Price Prediction 2024/2025/2030
Failure to solidify the bullish momentum will invalidate the forecast. Traders also need to watch out for the actions of institutions that hold Bitcoin.
Recently, Spot On Chain disclosed that the U.S. and German governments are selling BTC again. If this lingers, Bitcoin’s price may lose hold of $60,000 and drop to $59,795. In a highly bearish case, the price may plunge to $56,599.
Disclaimer
In line with the Trust Project guidelines, this price analysis article is for informational purposes only and should not be considered financial or investment advice. BeInCrypto is committed to accurate, unbiased reporting, but market conditions are subject to change without notice. Always conduct your own research and consult with a professional before making any financial decisions. Please note that our Terms and Conditions, Privacy Policy, and Disclaimers have been updated.